Jykan WaterFlood hazard and climate risk

Flood and climate numbers you can defend

Jykan Water assesses flood hazard and climate risk for municipalities, conservation authorities and engineering teams: design floods and rainfall, compound and coastal events, and the climate basis for risk decisions that have to stand up at council and in review

London, Ontario Working across Canada, with most projects in the Great Lakes basin and on the coasts.
  • Award-winning regional flood riskClimate analysis for a regional flood risk model that received an Award of Distinction at the 2025 Ontario Engineering Project Awards
  • Federal climate science contractsDownscaled daily projections for the whole Great Lakes and St. Lawrence basin, 1950 to 2100.
  • National standards workTechnical contribution to a Canadian guide for coastal flood risk assessment
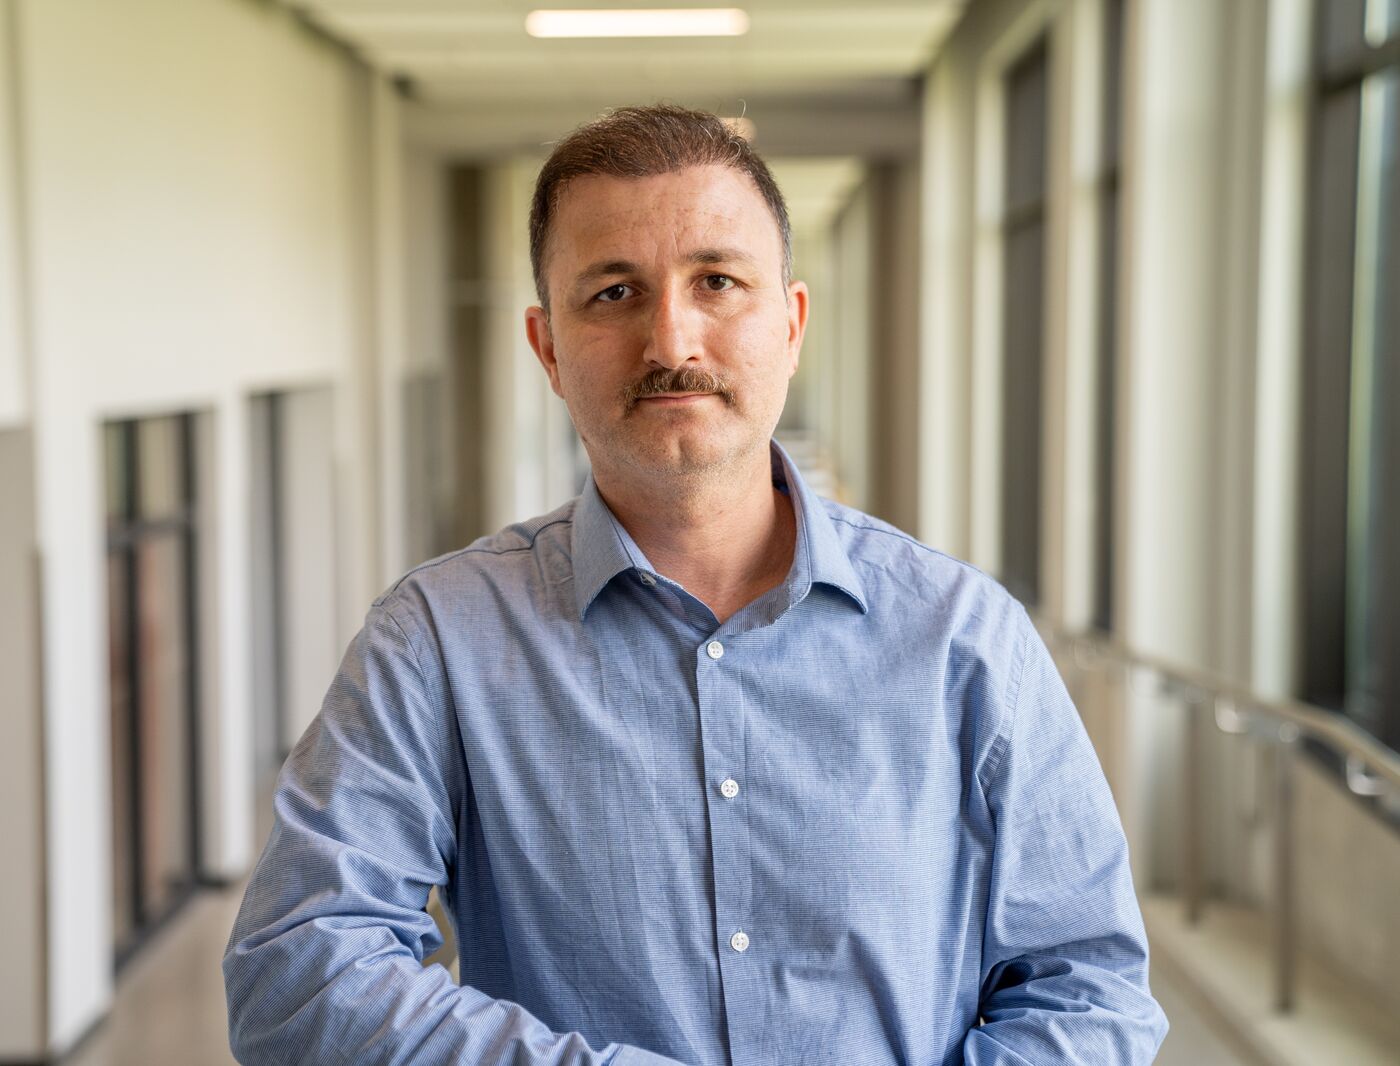
  • Led by a Professional EngineerReza Najafi, PhD, P.Eng., Professor of Civil and Environmental Engineering, Associate Editor of Water Resources Research

What we assess

Seven hazards, one discipline

Flood hazard and risk is the core of the firm. Around it sit the storms, rainfall and cascading events that feed it. Tap through the stories or let them play.

JWJykan Water
Riverine floodingHow often the river reaches a given level, and how that is changing

From hazard to decision

We follow flood risk all the way through

Most assignments start at the hazard and stop there. Ours carry the hazard through to the decision it is meant to support, or hand it cleanly to the team that does.

  1. Hazard

    How big, how often, and how that is changing: design floods, design rainfall, joint coastal water levels

    Frequency analysis, climate projections, hydrologic and hydraulic models

  2. Exposure

    What sits in the path: assets, networks and people inside each hazard footprint

    GIS overlays, remote sensing, street-level imagery

  3. Vulnerability

    How badly each asset is affected, and what fails next when it does

    Fragility and depth-damage relations, interdependency models

  4. Risk

    Hazard, exposure and vulnerability combined into rankings a manager can act on, with uncertainty shown

    Risk scoring, Bayesian networks, scenario comparison

  5. Adaptation

    Which options reduce the risk most for the money, and under which futures they still hold

    Scenario testing across warming levels, design value updates

Seen from orbit

The events we model, as the satellites saw them

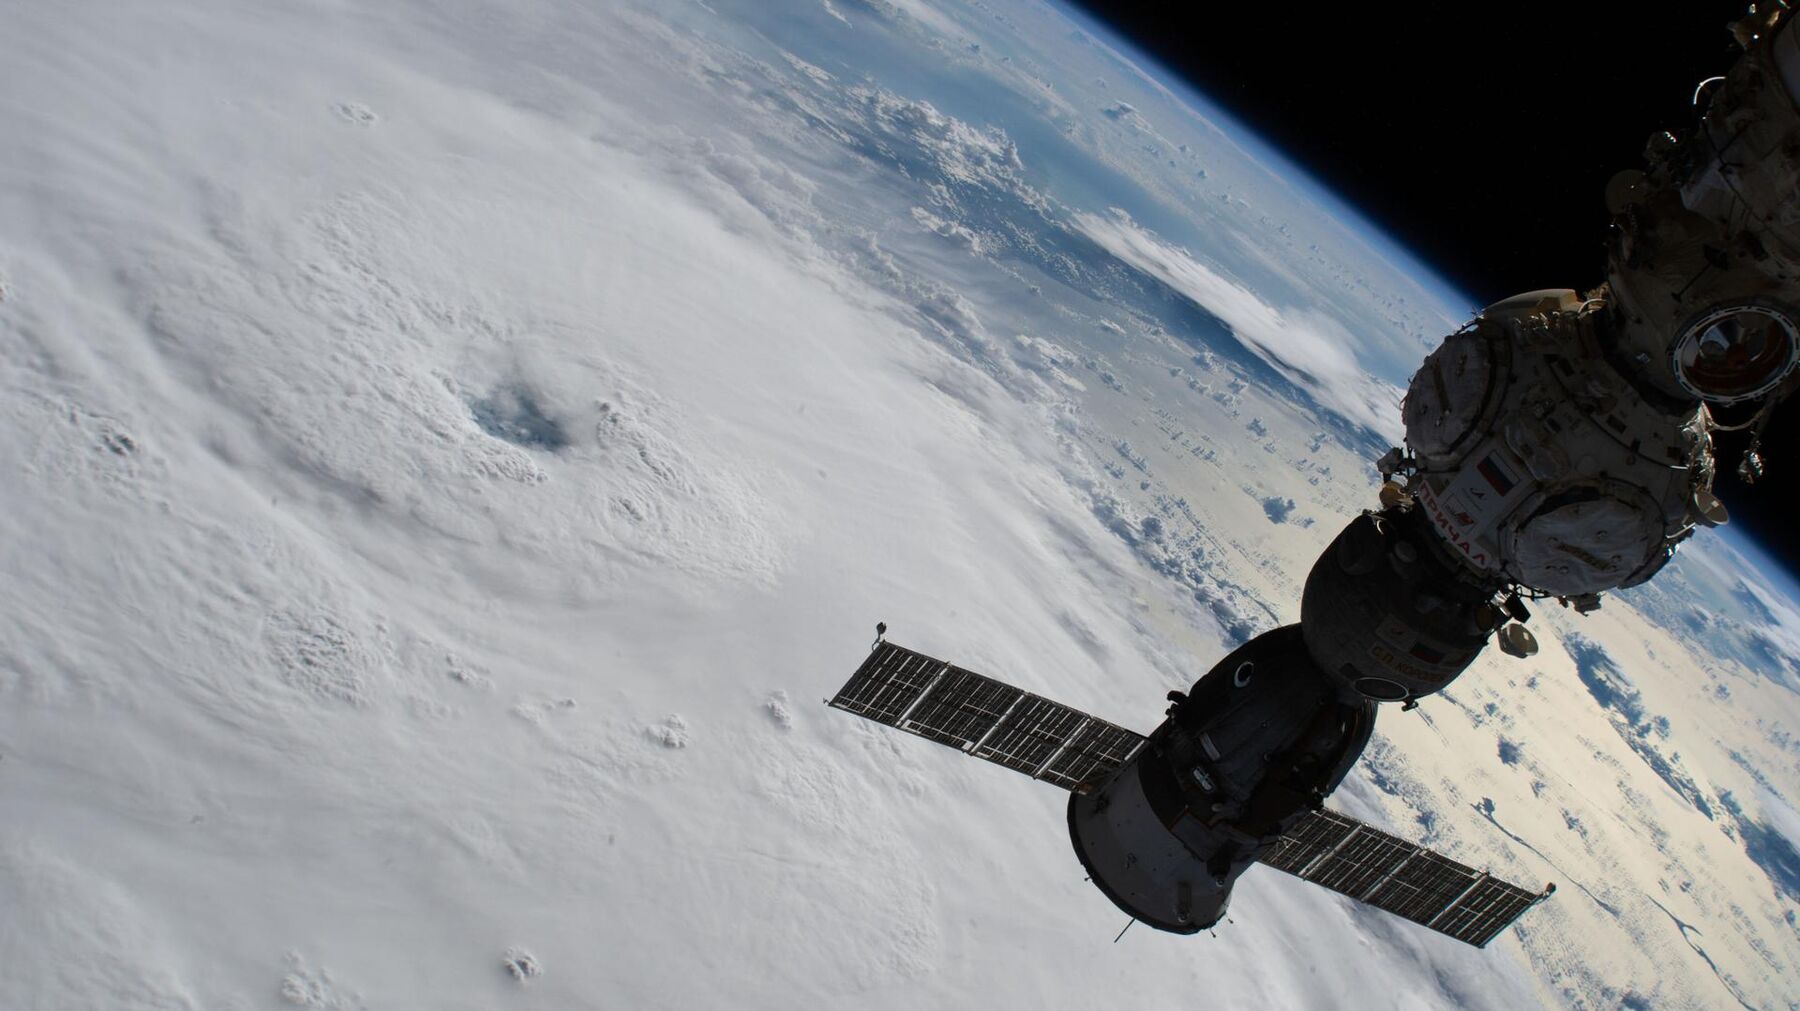
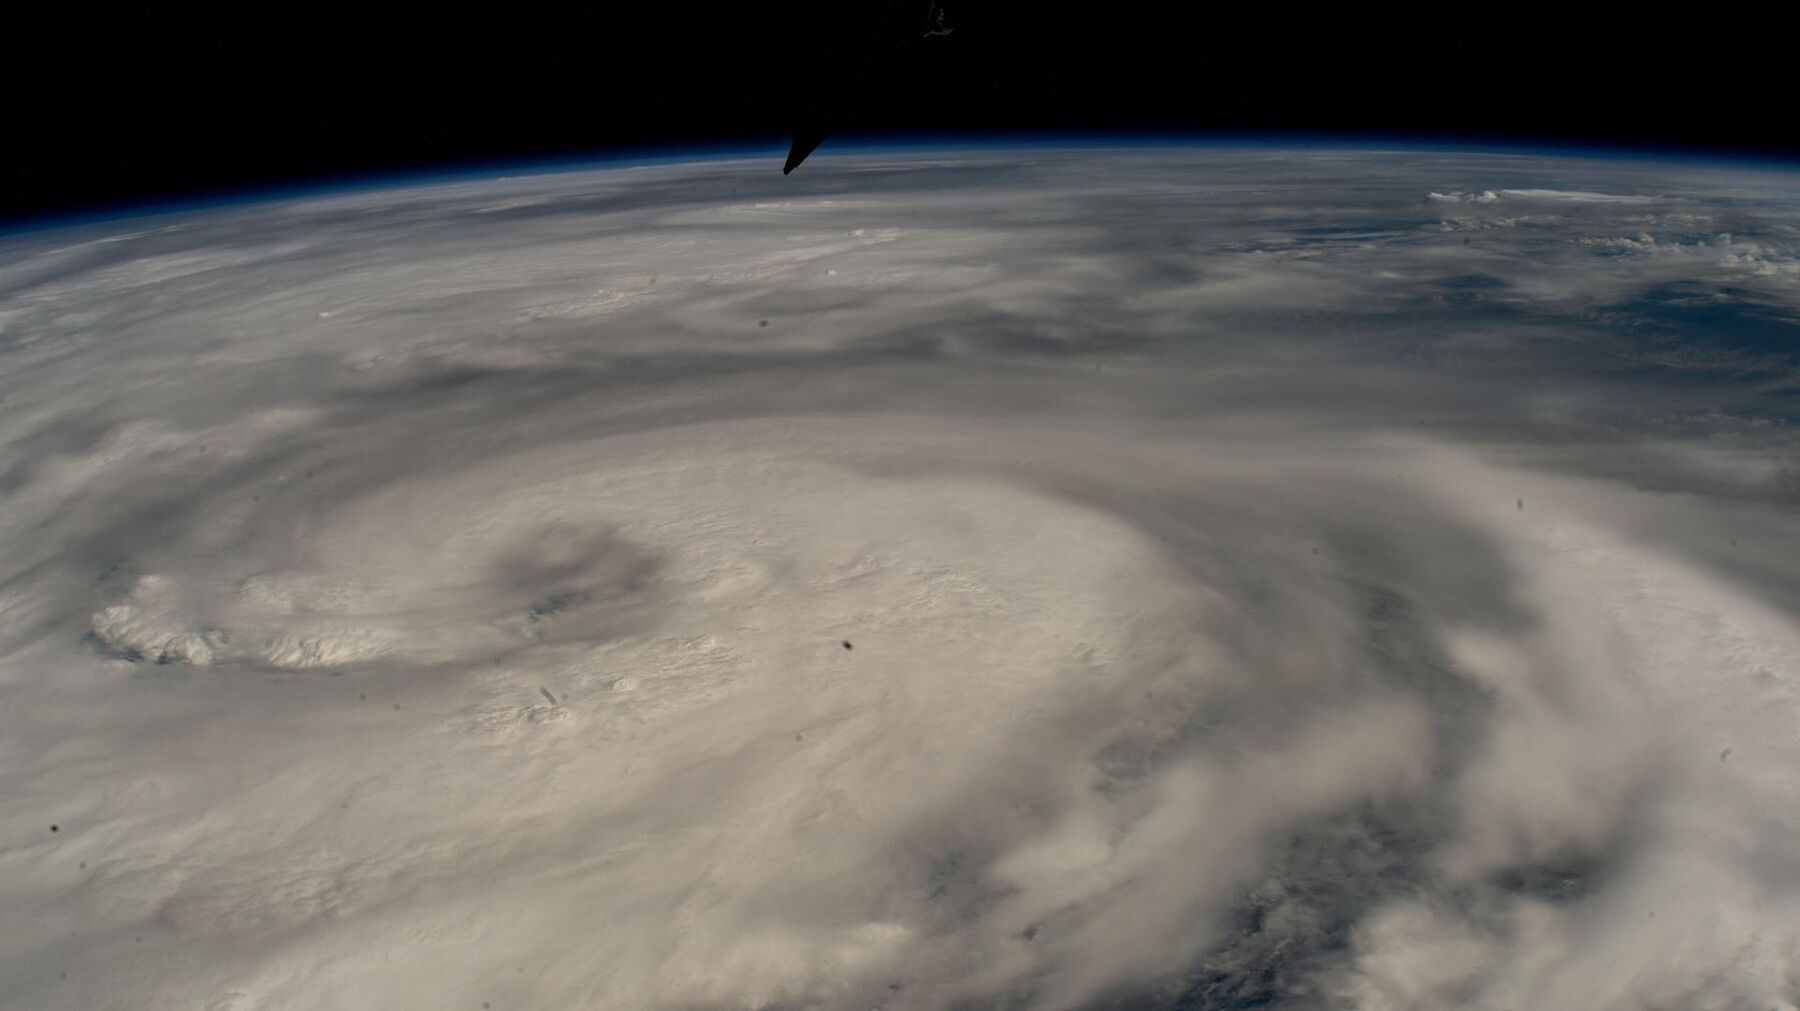
Hurricane Fiona from the space station, 2022
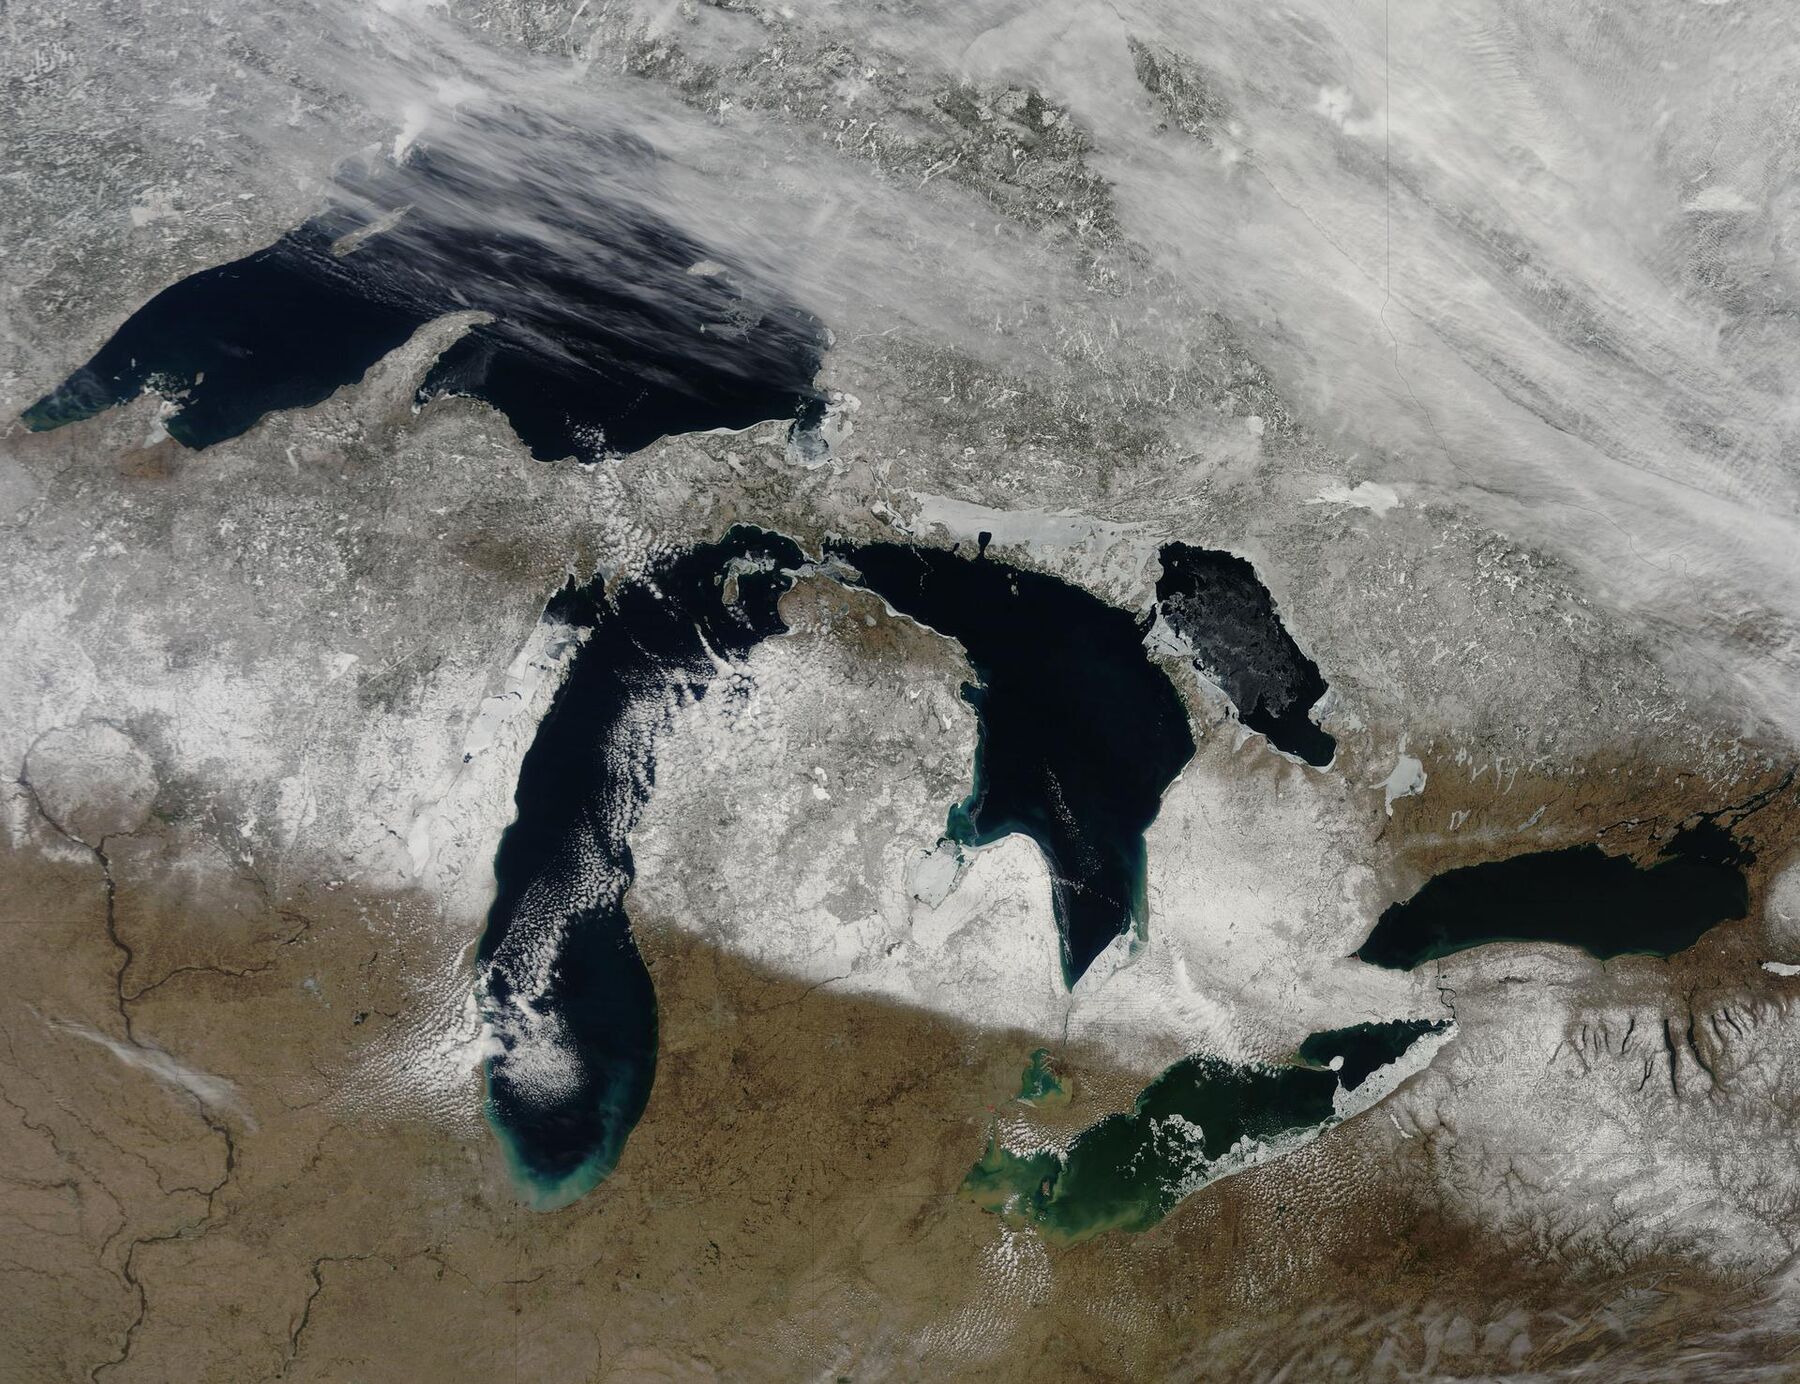
The Great Lakes in January
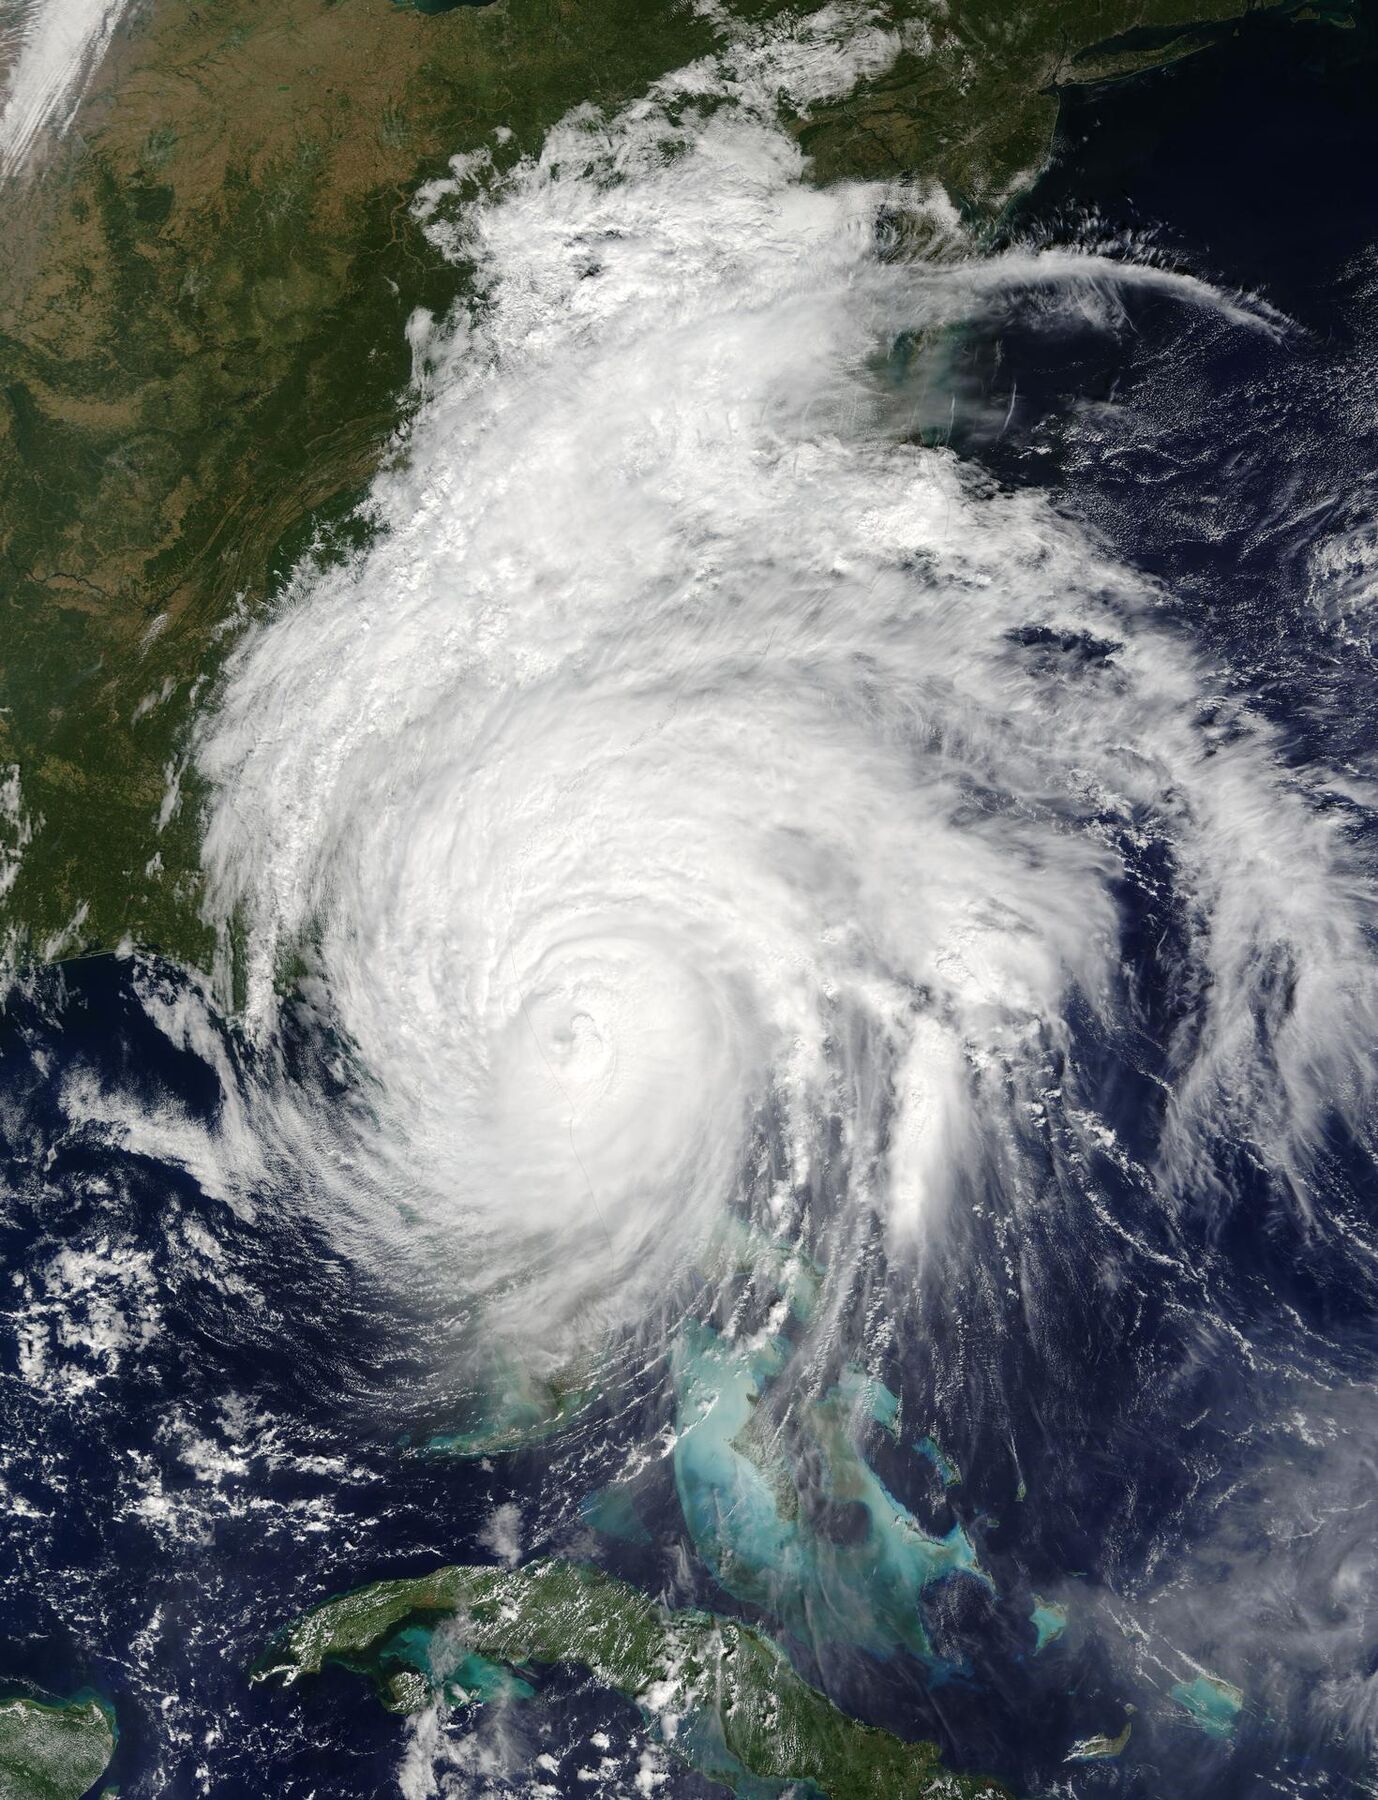
Hurricane Matthew over the Caribbean, 2016
Toronto and Niagara at night
Hurricane Helene from the space station, 2024
North America at night from orbit
The Great Lakes, cloud free
Coastline after Hurricane Dorian, 2019

Rainfall from space

Five days of Hurricane Matthew's rain over the Caribbean

Satellite rainfall estimates like these, from NASA's IMERG record, are one of the sources we combine with gauges, radar and reanalysis when rebuilding design rainfall for places where the gauge record is thin, from Saint Lucia and Cuba to Ontario towns

Animation: NASA Goddard Space Flight Center, Global Precipitation Measurement mission

Try it

How a design flood grows

A synthetic valley built to behave like a real study. Drag the return period, switch the climate scenario, and watch the flooded area and the buildings inside it.

Synthetic demonstration
Flooded land 0 haBuildings inside 0

Synthetic terrain and a simplified stage relation, not a real place or a projection. The numbers are for illustration only.

When flood probabilities change, design assumptions have to be revisited

Climate change can alter the frequency and severity of flooding, but the direction and size of the change depend on the watershed, the processes that generate floods there, and the scenario. In the synthetic example above, a stage that is today's 100-year level recurs about every 40 years in the 2050s. A real watershed may shift more, less, or the other way.

Our job is to replace the illustrative curve with yours: the actual gauges, a suitable climate ensemble, and a method a reviewer can follow, including the cases where the answer is "no significant change"

Stage against return period for the synthetic valley. Present climate in teal, 2050s in amber. Illustrative.

Recent Jykan Water work

Three contracts, described by what we actually delivered

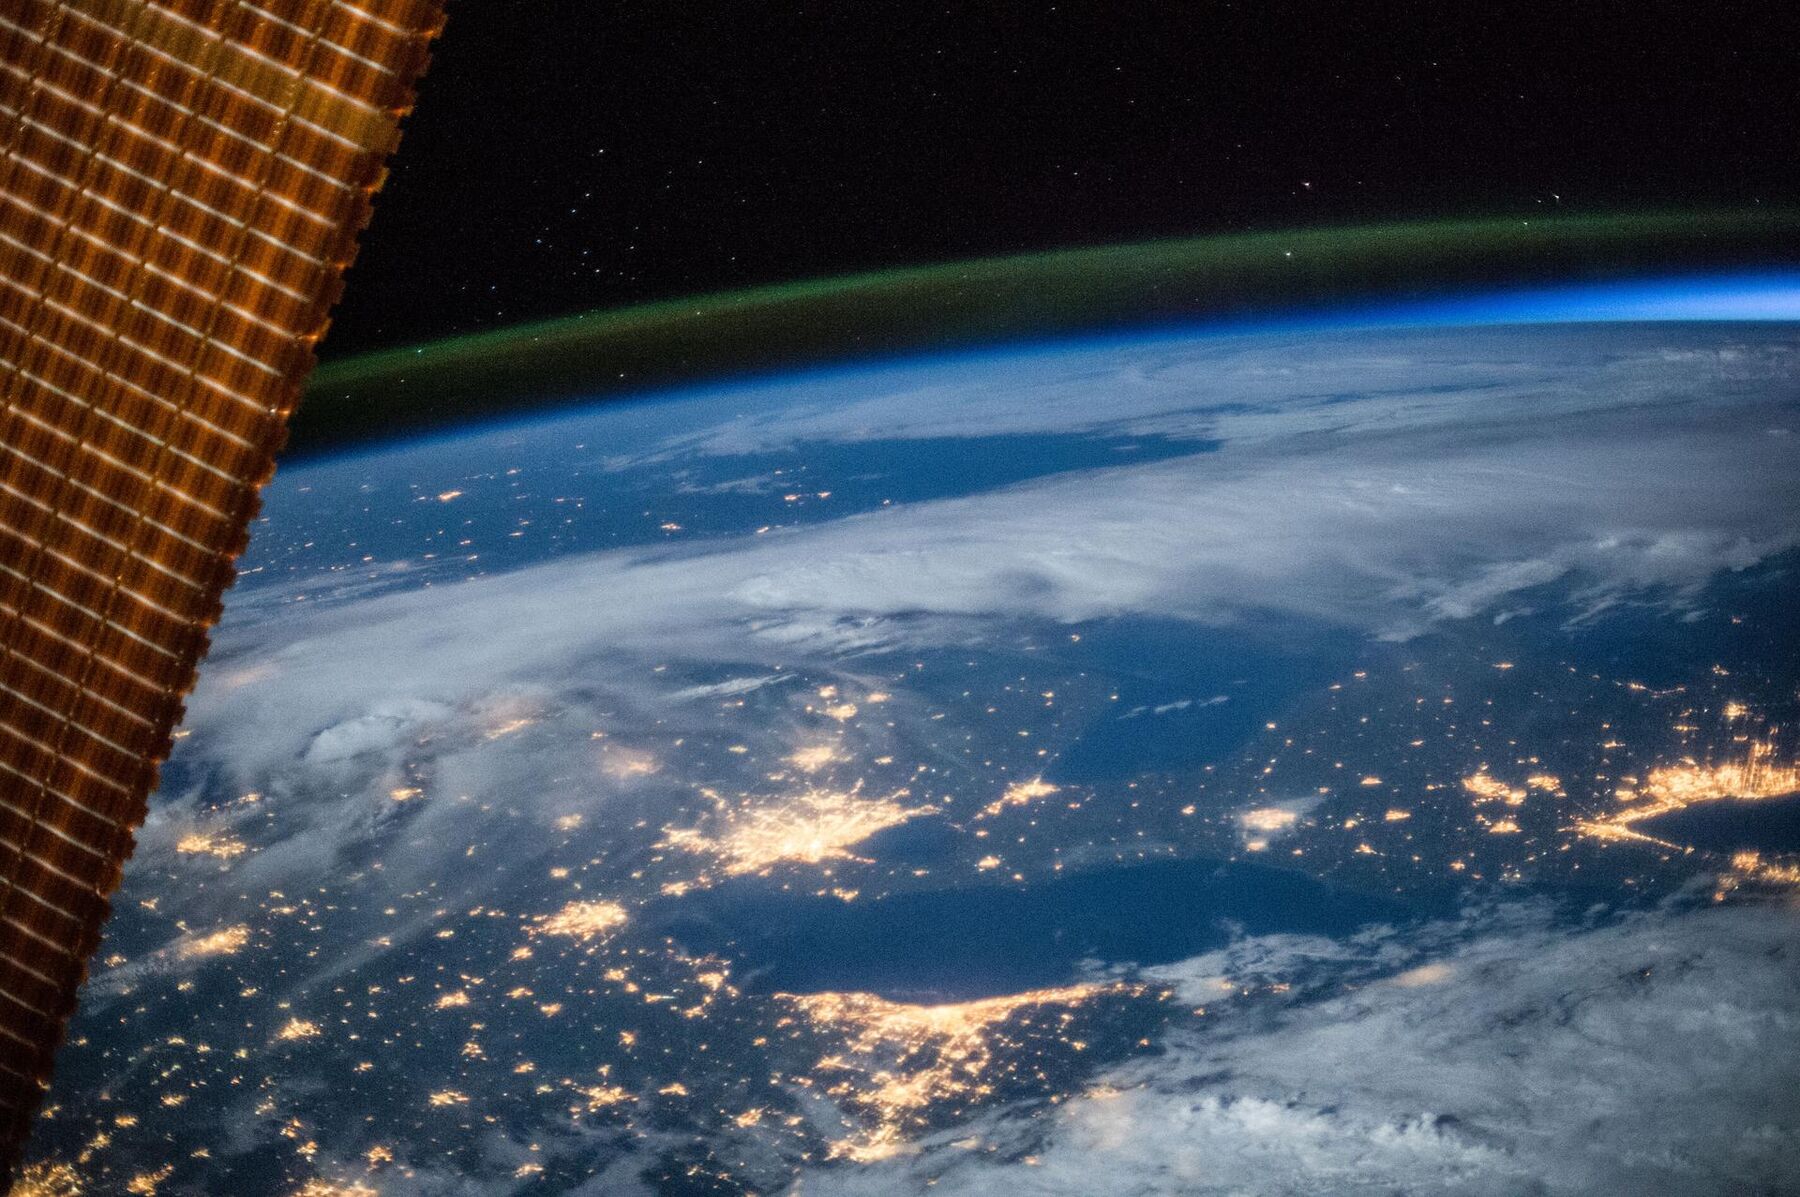
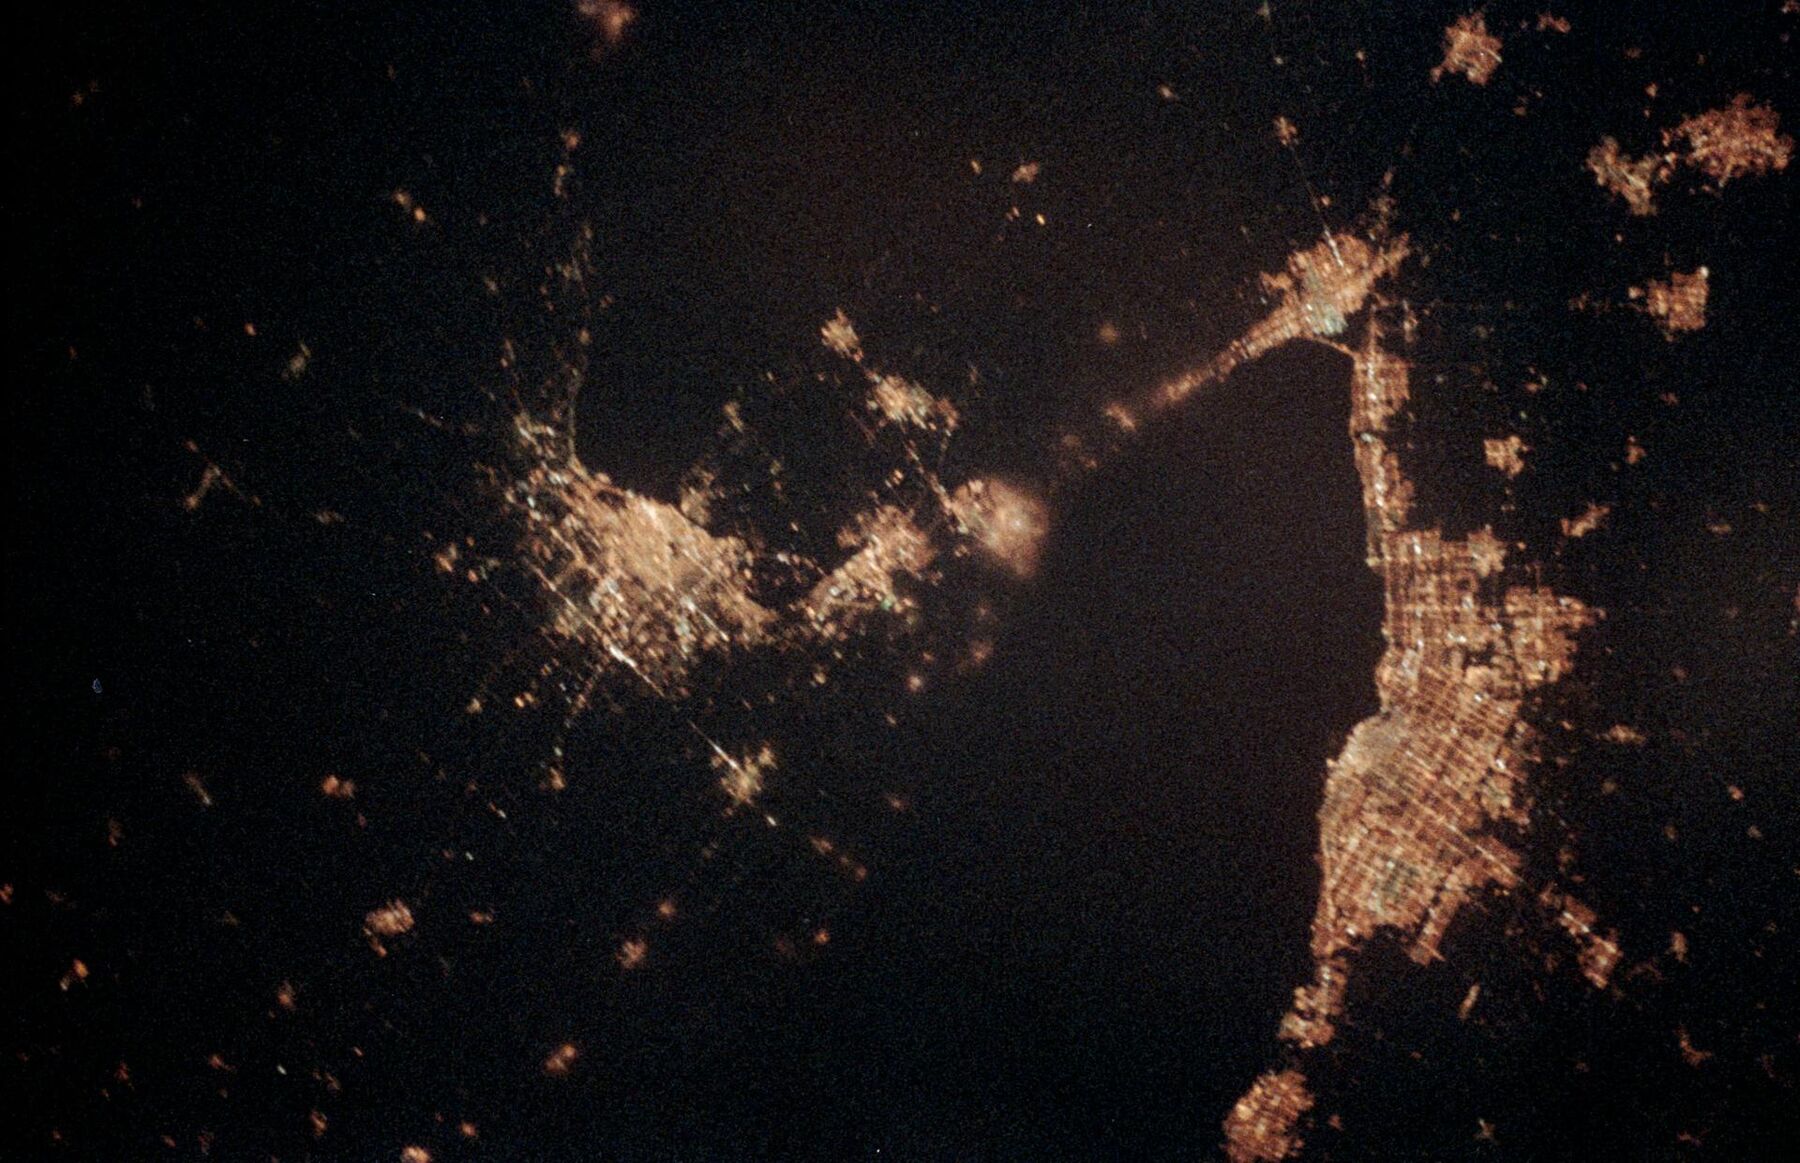
Toronto, Buffalo and Niagara Falls at night photographed by astronauts
The Greater Toronto Area and Niagara at night, seen by astronauts. Image: NASA
Project received an Award of Distinction, 2025 Ontario Engineering Project Awards (ACEC-Ontario)

Climate basis for a regional flood risk assessment model

Sub-consultant to the prime engineering firm for a regional municipality north of Toronto. Three phases, 2023 to 2024.

The region wanted climate considerations built into asset decisions, through a geospatial model that scores 100-hectare hexagons across its green, grey and blue infrastructure. Jykan Water supplied the climate basis: selection of CMIP6 and NA-CORDEX models, the timing at which each model reaches 1.5, 2 and 3 degrees of warming, projections of flood-related climate indices, and a separate set of indices for the region's 78,000 street trees and regional forest.

Jykan Water's part
Climate model selection, warming-level timing, projected climate indices, contributions to three technical memoranda, presentations to regional staff
Project outcome
The prime consultant's integrated assessment ranked twenty priority zones and developed recommendations for five; our climate analysis informed it
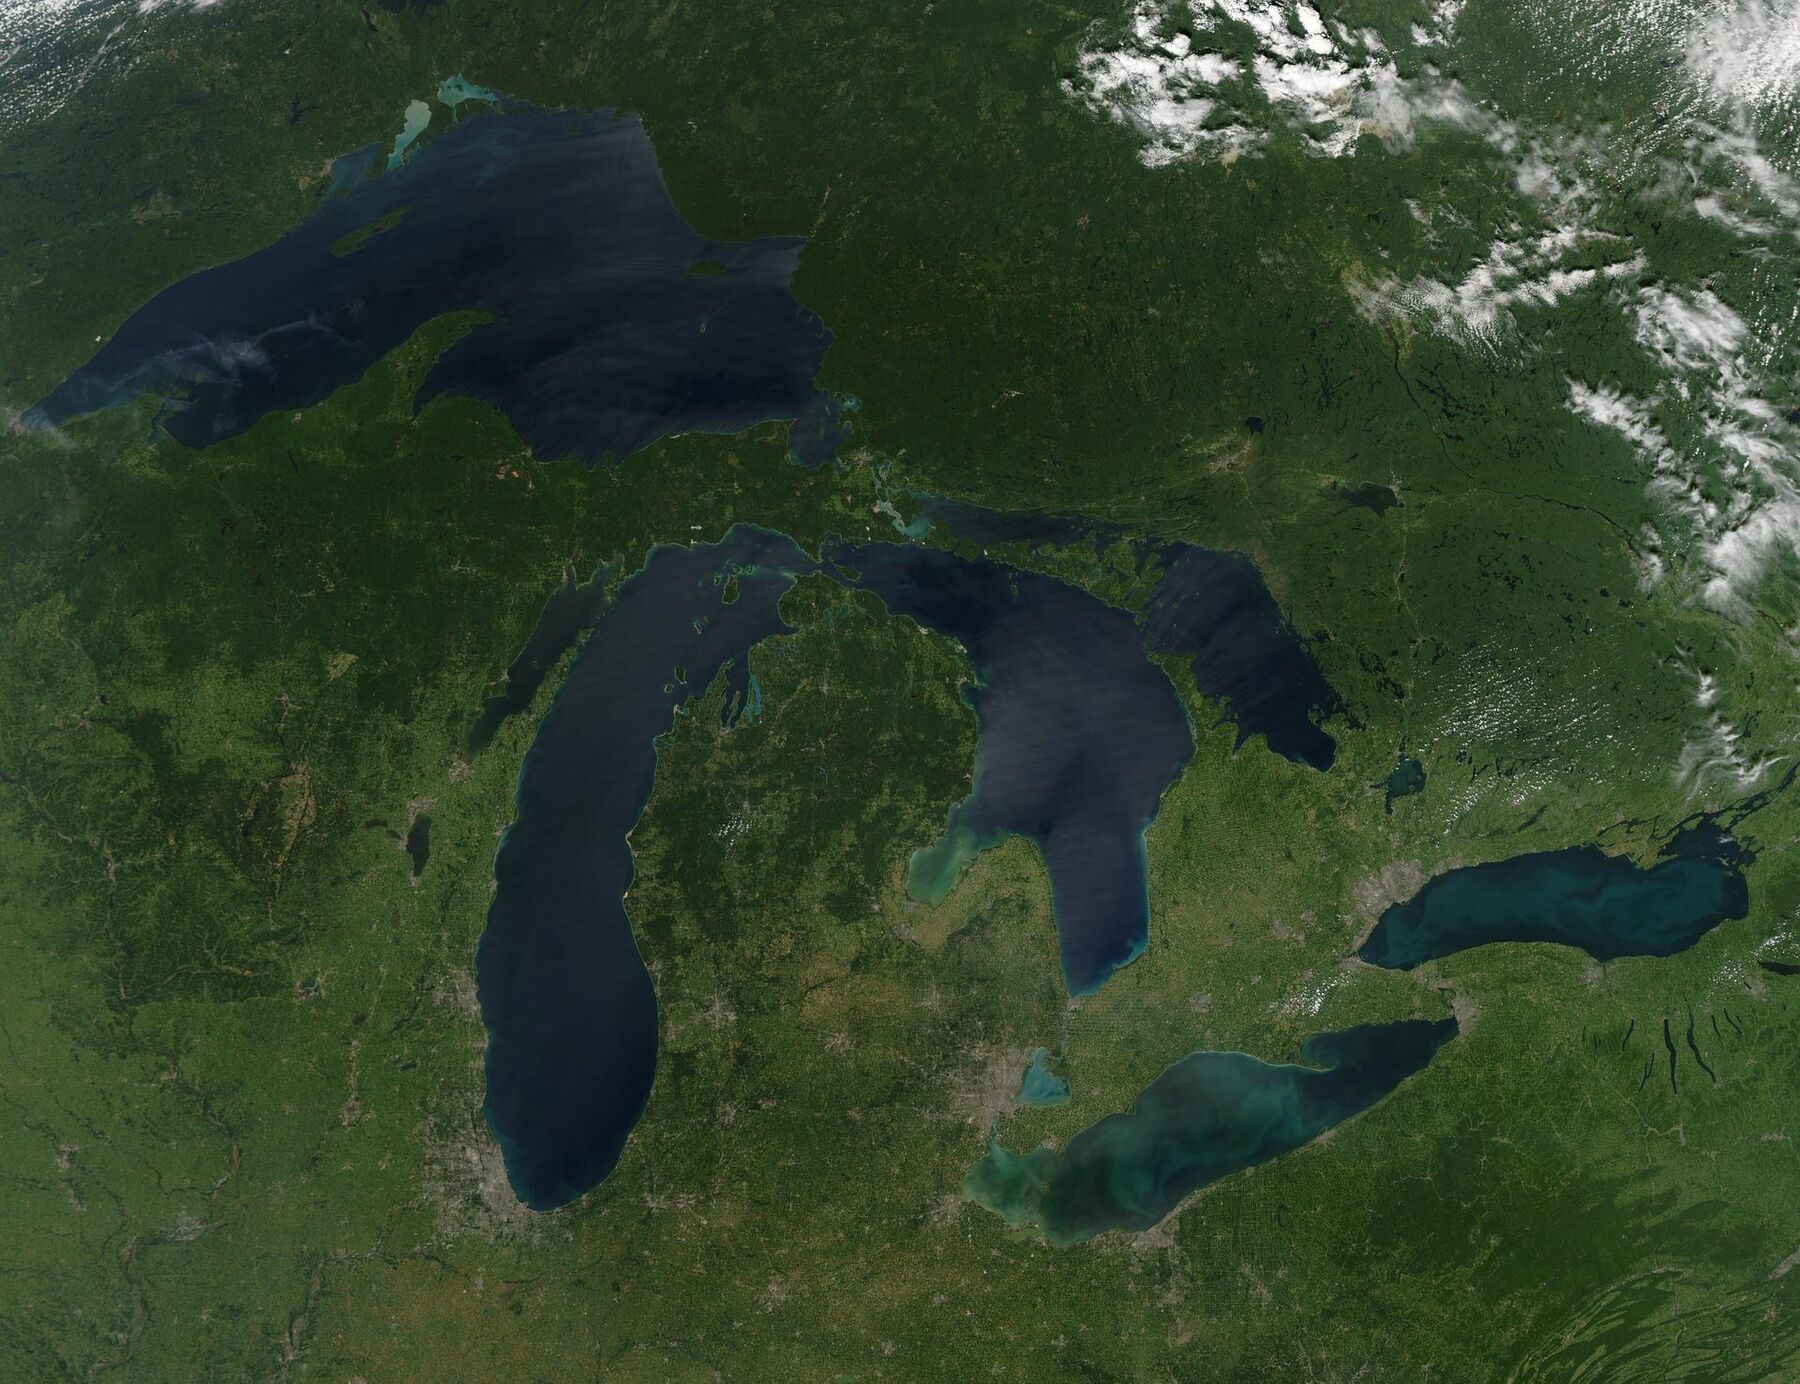
Cloud-free satellite view of the Great Lakes
The Great Lakes basin from orbit on a cloud-free day. Image: NASA Goddard

Daily climate projections for the Great Lakes and St. Lawrence basin

For a federal climate science department. Fixed-price contract, completed March 2023.

Eight CMIP6 models were selected for their representation of the ensemble over eastern North America and their inclusion of the Great Lakes, and five daily variables were bias-corrected with the multivariate MBCn method for two emissions pathways, covering 1950 to 2100

Delivered
Gridded daily dataset, evaluation report, warming-level change analysis
Used for
Climate impact and water-management studies across the basin
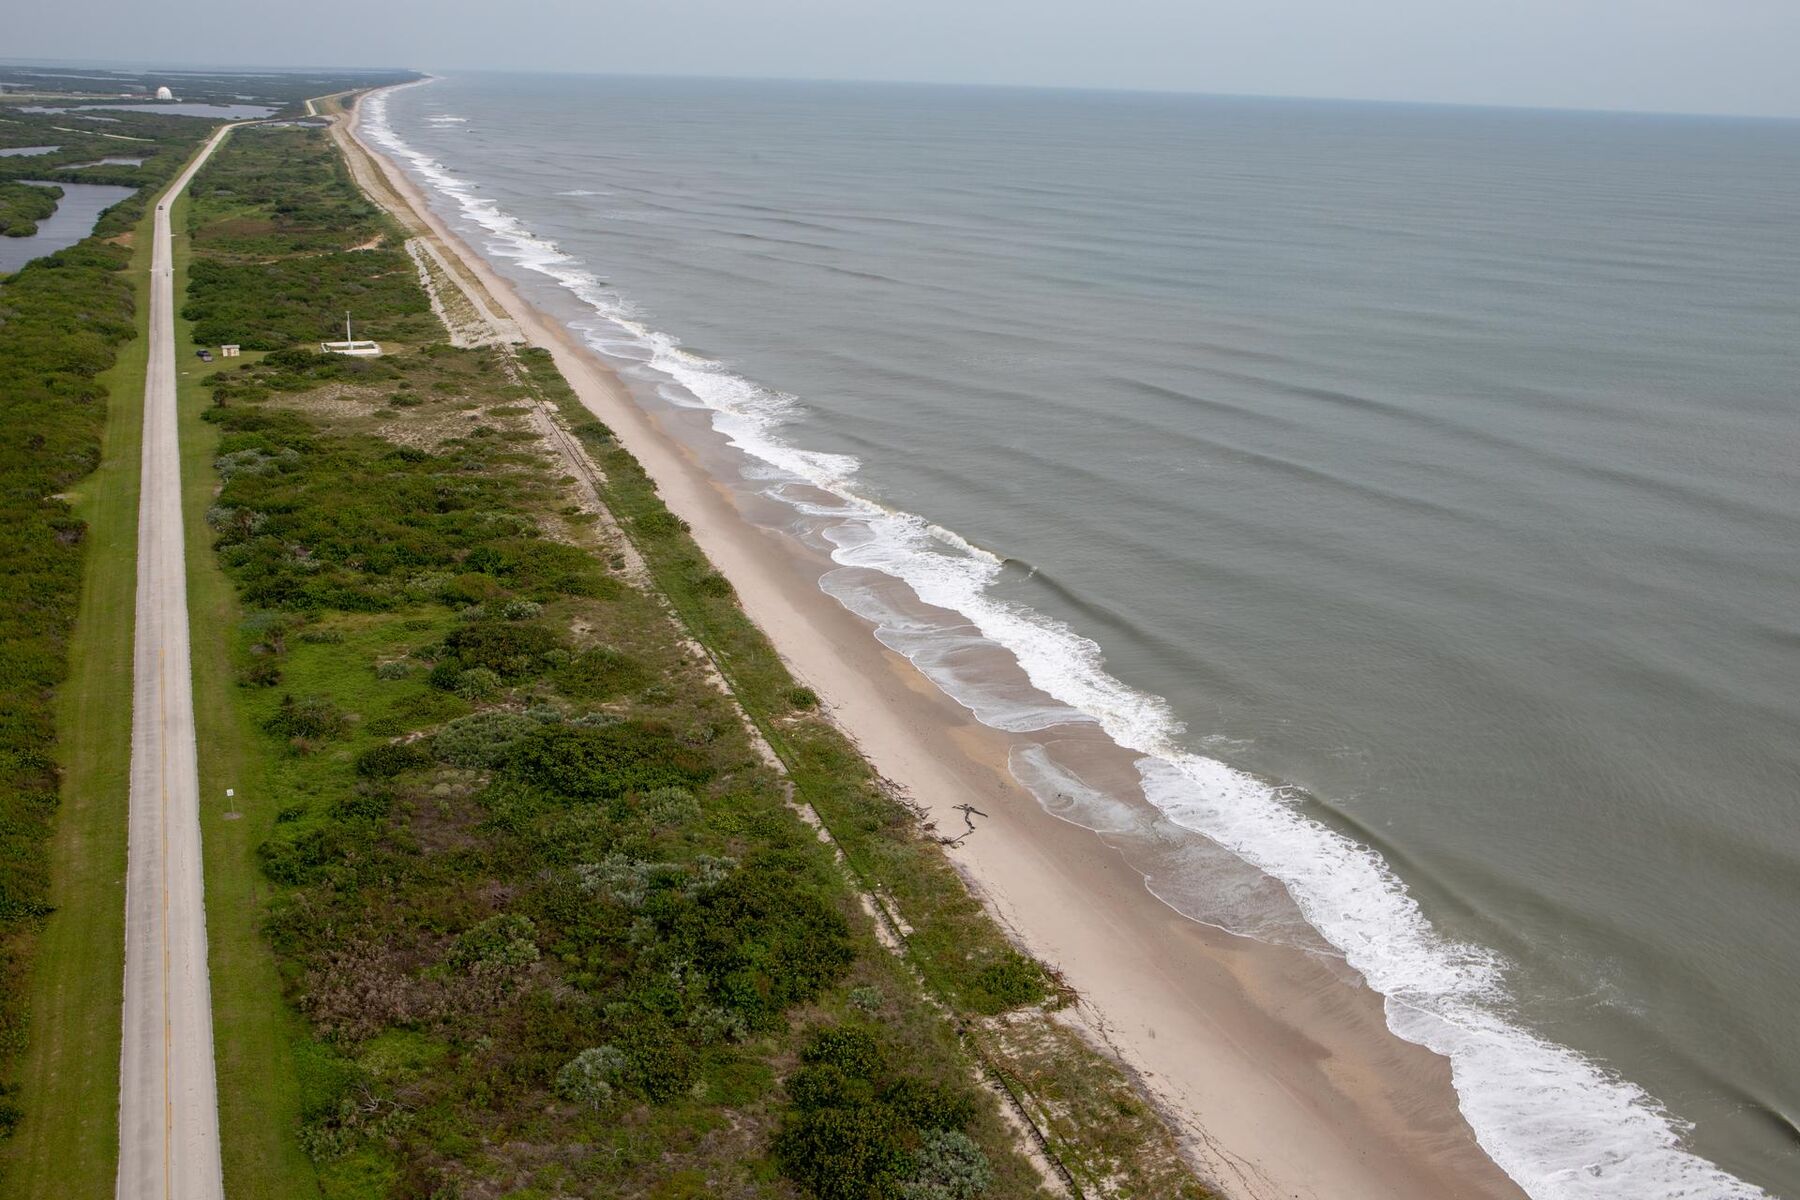
Aerial view of a barrier beach and eroded dunes after Hurricane Dorian
Beach and dunes surveyed from the air after Hurricane Dorian, 2019. Image: NASA

Implementation guide for a national coastal flood risk standard

For a national standards development organization. 2024 to 2025

Technical content on the coastal hazard chain (still water level, surge, wave setup and runup, sea-level and lake-level change), on combining drivers that occur together, and on carrying hazard through to risk, with worked examples

Jykan Water's part
Drafted technical sections, worked examples and technical review of the guide's drafts

All projects and the full track record

Track record

Hazard and risk work, from the Pacific to the Caribbean

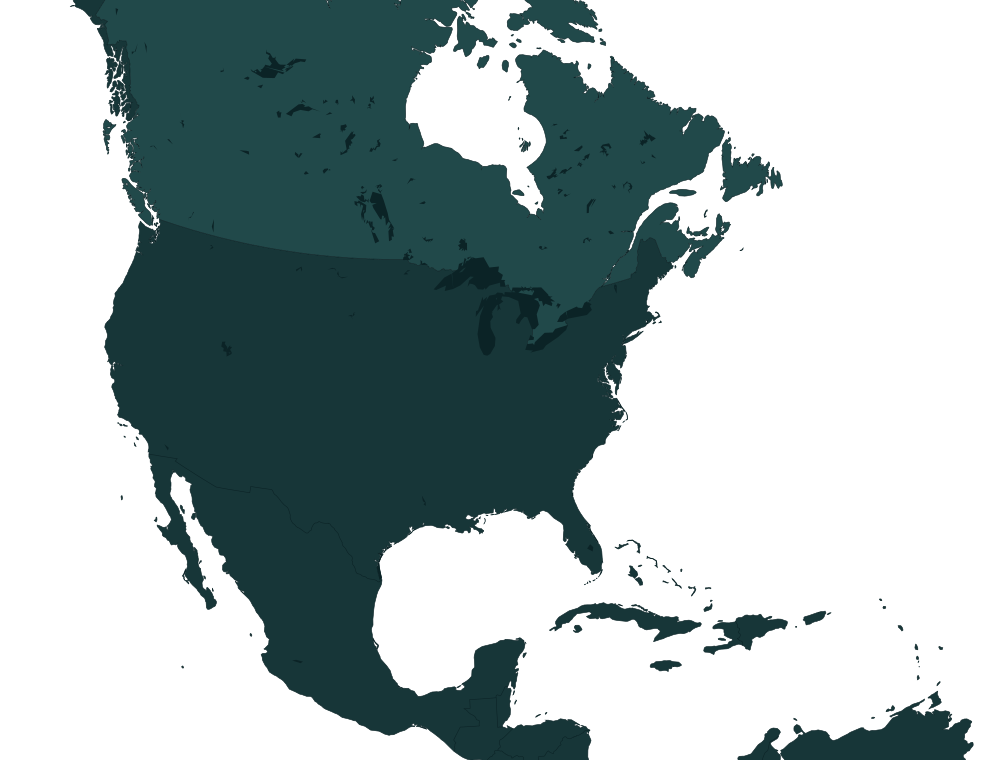
Amber marks Jykan Water contracts. Teal rings mark work Reza Najafi led through Western University, listed so you can judge the depth behind the firm; it is not presented as Jykan Water's.

Map of North America and the Caribbean with project locations marked
Jykan Water contractUniversity-led workMap data: Natural Earth; lakes © OpenStreetMap contributors

Methods with a paper trail

The methods are published, so reviewers can check them

A selection of peer-reviewed work on flood hazard and risk led from Reza Najafi's research group, from more than eighty journal articles in total

  • Characterizing compound inland flooding mechanisms and risks in North America under climate changeEarth's Future, 2025
  • Atmospheric rivers as triggers of compound flooding: quantifying extreme joint events in western North America under climate changeNatural Hazards and Earth System Sciences, 2026
  • Nonstationary frequency analysis of compound flooding in Canada's coastal zonesCoastal Engineering, 2023
  • Machine learning-based regional flood frequency framework for climate resilient infrastructureJournal of Hydrology, 2025
  • A flood risk assessment framework for interdependent infrastructure systems in coastal environmentsSustainable Cities and Society, 2021
  • Probabilistic assessment of concurrent tornado and storm-related flash flood (TORFF) eventsInternational Journal of Climatology, 2023
Reza Najafi

Talk to the engineer who will do the work

There is no sales team. Describe the decision and the deadline, and you'll hear back from Reza Najafi within two business days with a view on scope, approach and whether Jykan Water is the right fit.